Normalization
Normalization is a preprocessing method which is applied to rows of the dataset (e.g. individual spectra or abundance values for individual measurements) in order to make all rows meet the same requirement. Depending on the requirement, different normalization types exist. In mdatools the following methods are implemented:
"area"— normalize every row to unit area under measurement points. The area is computed as a sum of absolute values from each row."sum"— makes all values of each row sum up to one (similar to"area"but it takes sum of the original values, not the absolute ones)."length"— normalize every row, so if a row is represented as a vector in variable space, this vector will have a unit Euclidean length."snv"— Standard Normal Variate, makes all values from the same row have zero mean and unit standard deviation (is also described in the previous section as this normalization is often used for correction of baseline in spectral data)."is"— Internal standard normalization. This is common for spectroscopic data, the values from each row will be normalized so the value for a given variable (or sum of values for several variables) are equal to one. Usually the variable corresponds to characteristic peak of an internal standard."pqn"— Probabilistic Quotient Normalization, a method described in this paper.
All methods are implemented in function prep.norm; you just need to provide the name of the method as a second argument (or named argument type). Internal standard normalization also requires an additional argument, which specifies index of column (or several columns), corresponding to the internal standard. The Probabilistic Quotient Normalization requires reference spectrum as an additional argument.
An example below shows how to make normalization for several selected types using the Simdata:
# get spectral data and wavelength
data(simdata)
w = simdata$wavelength

X1 = simdata$spectra.c
attr(X1, "xaxis.values") = w
attr(X1, "xaxis.name") = "Wavelength, nm"

# unit area normalization
X2 = prep.norm(X1, "area")
# unit length normalization
X3 = prep.norm(X1, "length")
# internal standard normalization for variable (column) with wavelength 291 nm
X4 = prep.norm(X1, "is", col.ind = match(291, w))

# show the original and preprocessed spectra
par(mfrow = c(2, 2))

mdaplot(X1, type = "l", main = "Original")
abline(v = 291, lty = 2, col = "#00000080")

mdaplot(X2, type = "l", main = "Normalized to unit area")
mdaplot(X3, type = "l", main = "Normalized to unit length")
mdaplot(X4, type = "l", main = "Normalized to IS (291 nm)")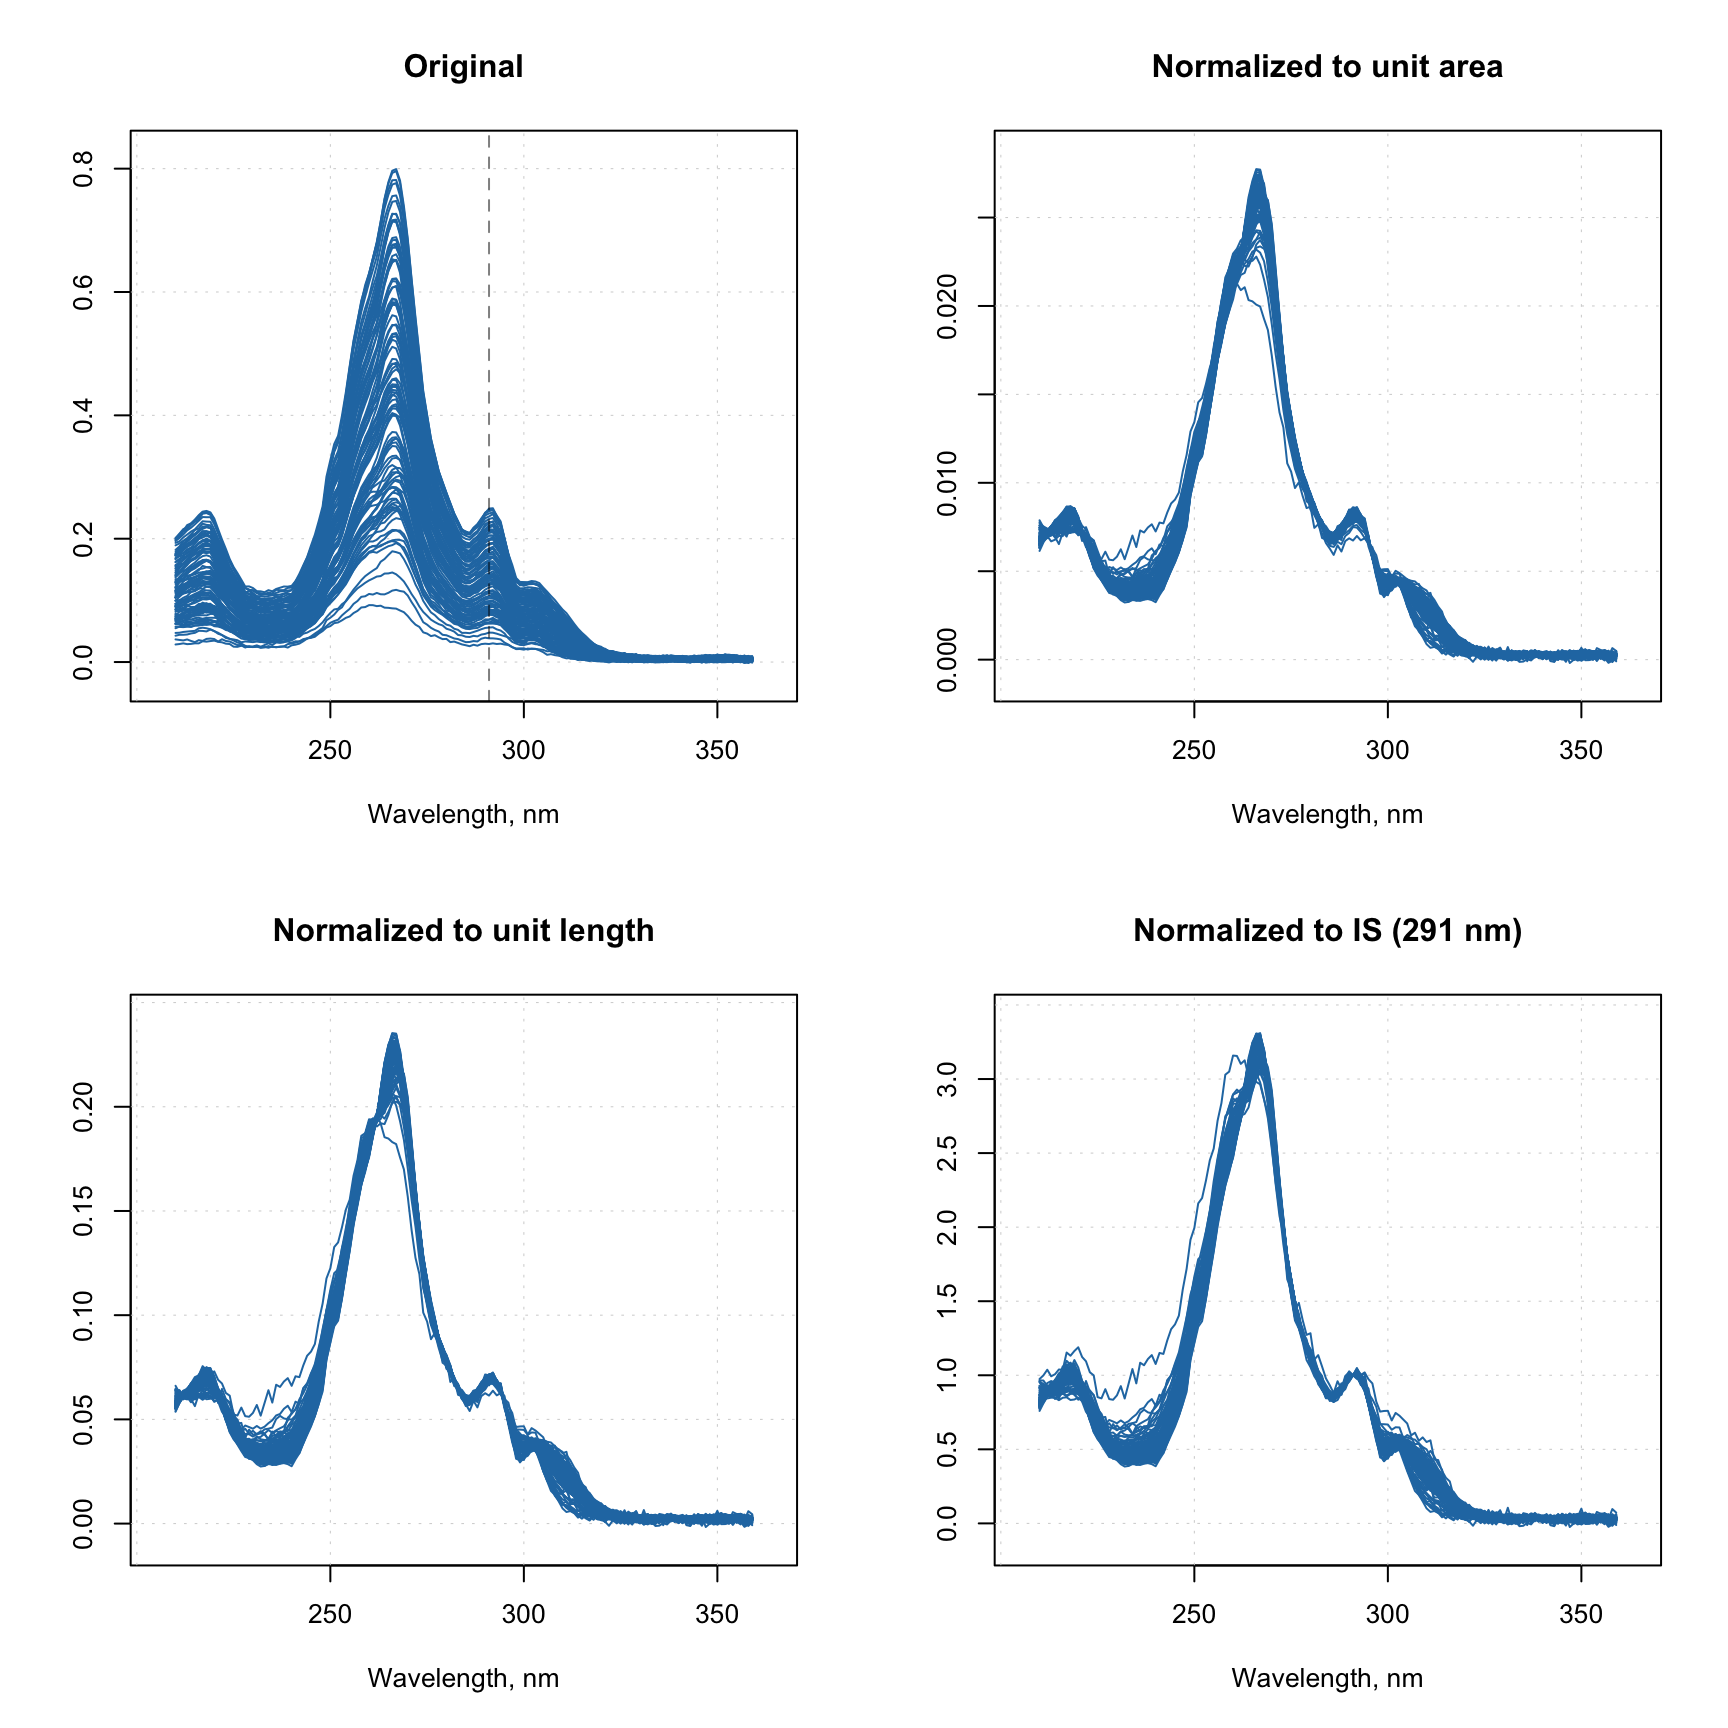
The vertical dashed line on the first plot shows position of the peak, which we use as internal standard for preprocessing shown on the last plot.