Procrustes cross-validation
Procrustes cross-validation (PCV) is a new approach for validation of PCA and SIMCA models. You can find detailed description of the method with numerous examples in this paper.
PCV makes possible to generate a new dataset, named pseudo-validation set and use it for validation of models in the same way as with an independent test set. The generation is done using following algorithm:
- A global PCA model is created using calibration set X and A components
- The rows of matrix X are split into K segments using venetian blinds splitting
- For each segment k from {1, 2, …, K}:
- a local PCA model is created using the rows from the segment
- an angle between the local and the global model is estimated
- rows from the current segment are rotated in original variable space by the angle
- All rotated measurements are then combined into a matrix with pseudo-validation set
So, pseudo-validation set is built on top of the calibration set but has its own sampling error. Since it is not independent from the calibration set we recommend to limit its use by model optimization and do not use it for assessment of performance of the final model.
The syntax is quite simple:
pvset <- pcv(X, ncomp, nseg, scale)Here X is your calibration set (as a numerical matrix), ncomp is a number of principal components for PCA decomposition (use at lease enough to explain 95-99% of variation of the data values), nseg is the number of segments for cross-validation procedure. So far only systematic cross-validation (venetian blinds) is supported, so make sure that rows of X are sorted correctly or shuffled. Parameter scale allows to standardize your data prior to the generation, which is useful if your variables have different nature and/or units. The generated data will be unscaled though.
The code below show an example, where we generate pseudo-validation set for spectra from the Simdata. The plots show spectra from both sets.
data(simdata)
spectra = simdata$spectra.c

# create pseudo-validation set
spectra_pv = pcv(spectra, ncomp = 6, nseg = 4)

# show plot with original and generated spectra
par(mfrow = c(2, 1))
mdaplot(spectra, type = "l", main = "Original")
mdaplot(spectra_pv, type = "l", main = "Pseudo-validation")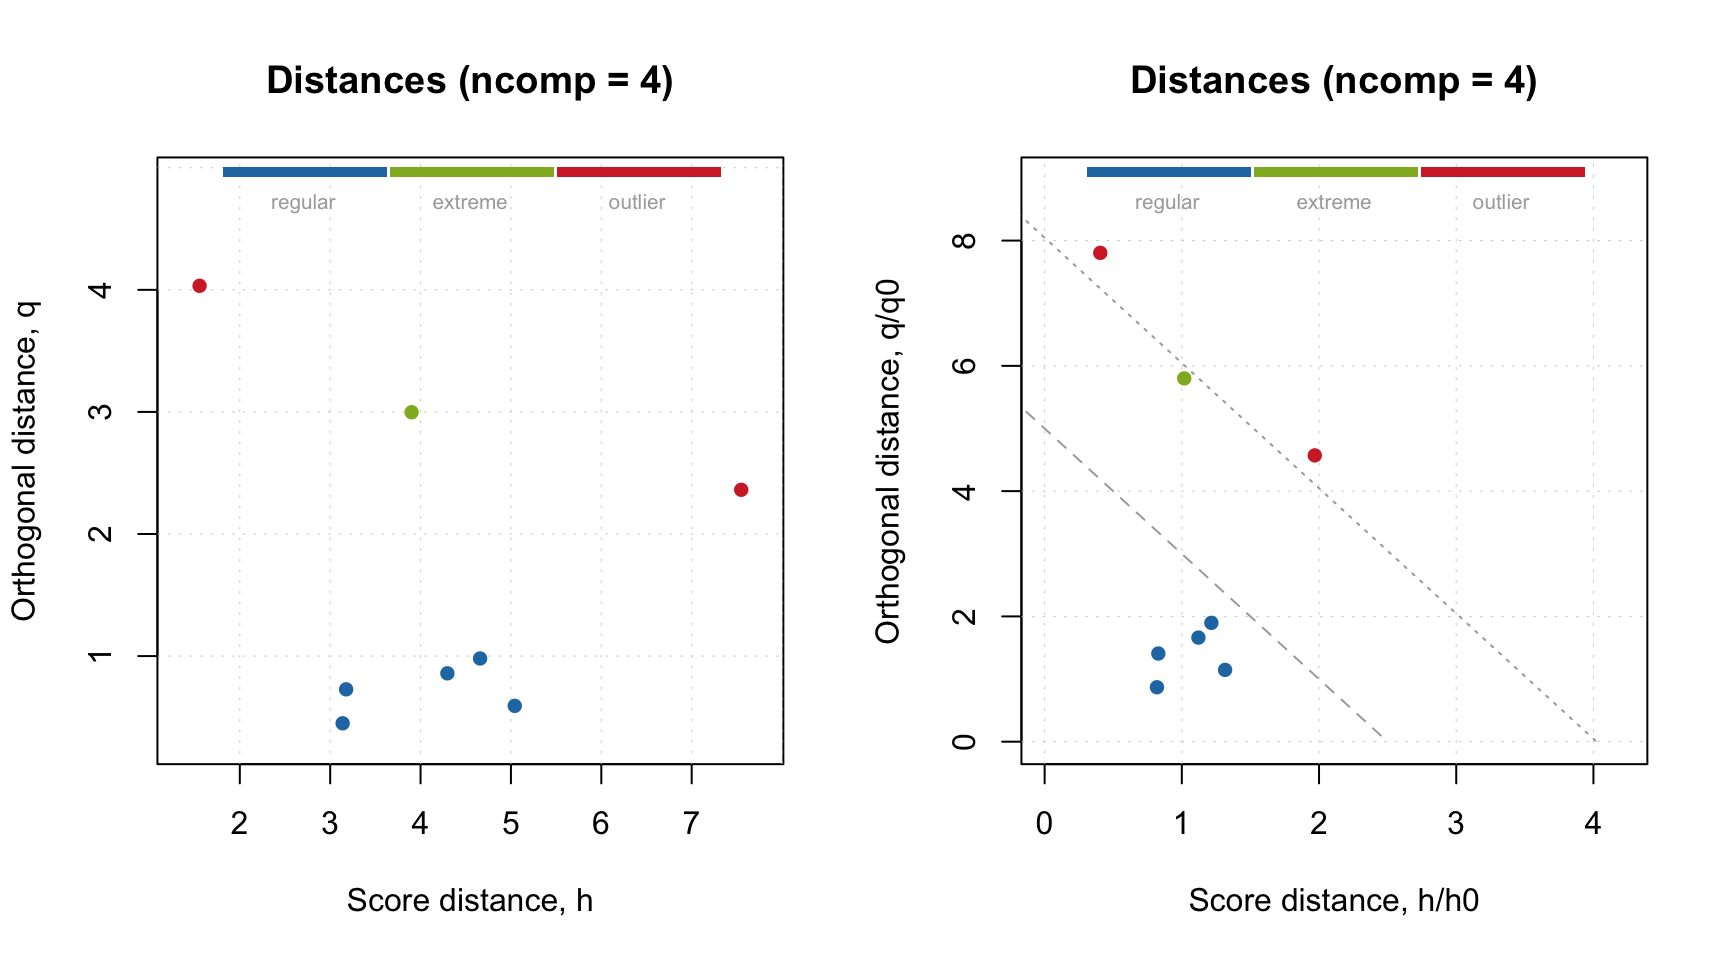
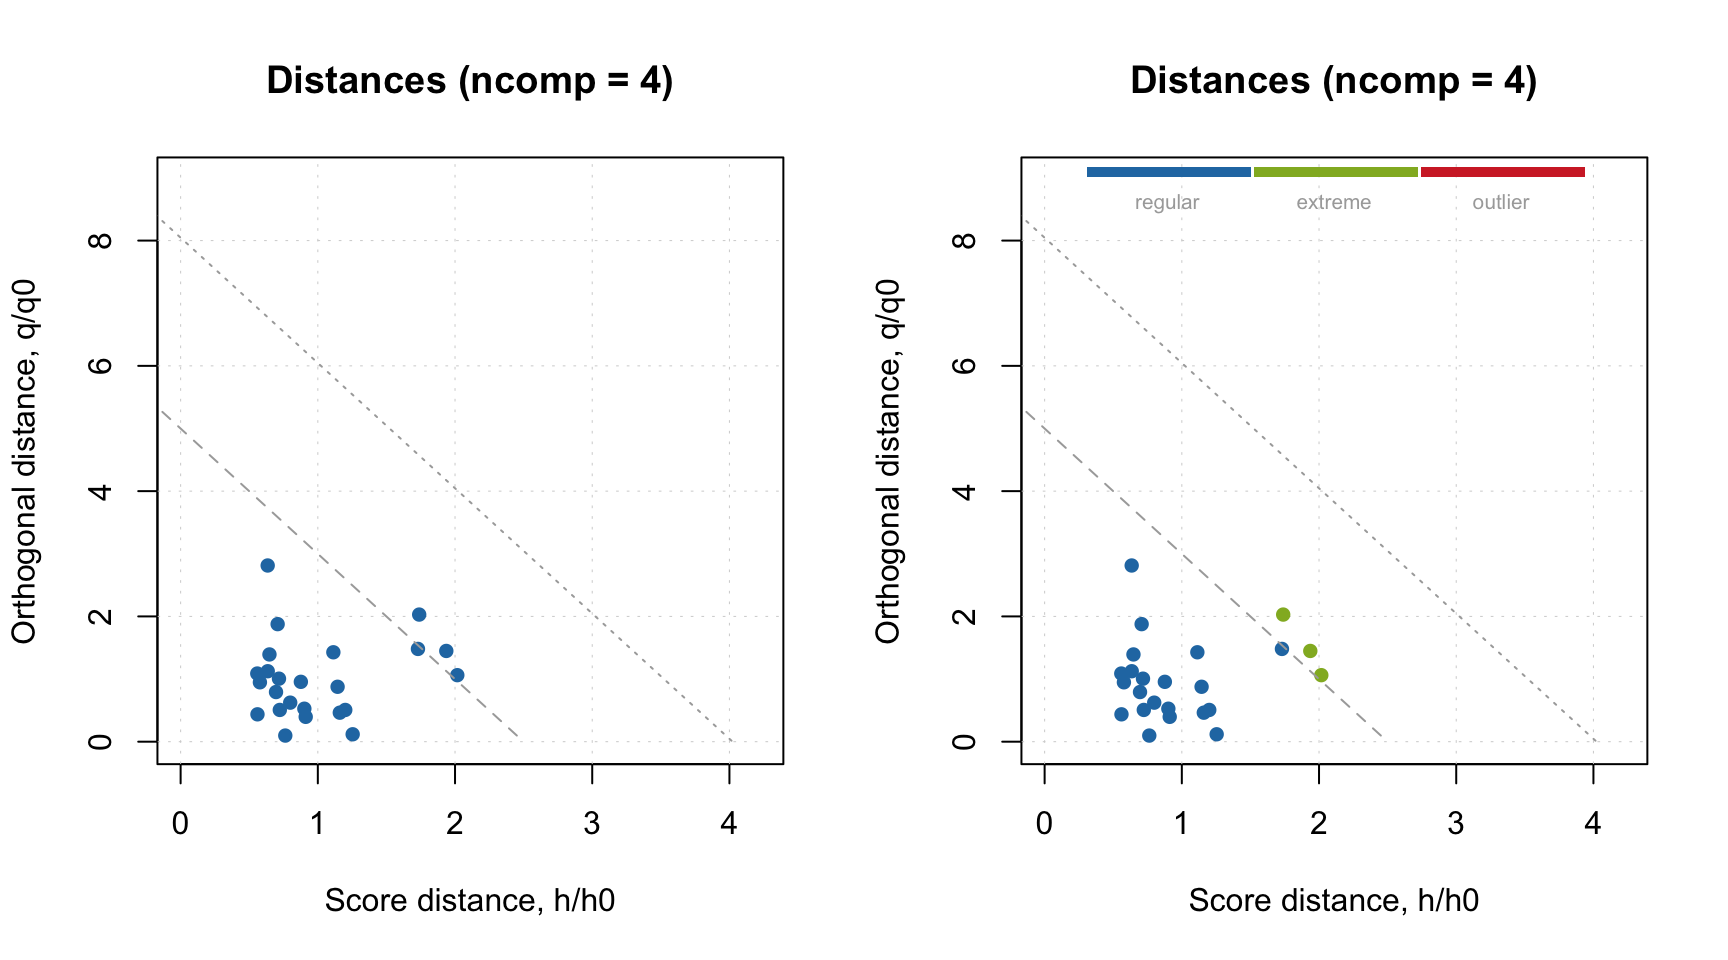
On one hand, the plots seem very similar, almost identical. However this is not true. Let’s use the generated pseudo-validation set as a test set. For example, we can make an Extreme plot and find out that fourth component leads to overfitted model. Note, that if we make this plot for the calibration set (left), we do not see any signs of overfitting.
# make PCA model for calibration set
m = pca(spectra, 6)

# project pseudo-validation set to the model
res_pv = predict(m, spectra_pv)

# show extreme plot for A = 4
par(mfrow = c(1, 2))
plotExtreme(m, res = m$res$cal, comp = 4, main = "Extreme (cal)")
plotExtreme(m, res = res_pv, comp = 4, main = "Extreme (pv)")